


How Belmont Park Unified Seven Business Systems Into One Source of Truth
How do you make critical business decisions when your data lives in seven different isolated systems? That was the challenge facing Belmont Park, San Diego’s iconic entertainment destination.
As the organization approached its 100-year milestone and continued investing in modernization, leadership recognized that the next stage of growth would not come from new attractions alone. It would come from operational intelligence.

At a Glance
Case Study · Entertainment & Hospitality · San Diego, CA
- 7 →1 — Data sources unified into one platform
- Zero — Cross-system visibility before the project
- 12 weeks — Design to production
- Live — Dashboards replaced monthly report cycles

The Business Behind the Rides
One of San Diego's Most Iconic Entertainment Destinations
Key Facts
- Founded: July 4, 1925 · Centennial milestone reached in 2025
- Visitors: Estimated 2 million annually
- Ranking: Top 10 things to do in San Diego per tourism authorities
- Location: Mission Beach, San Diego · 32 million city visitors annually
Founded on July 4, 1925, Belmont Park is consistently ranked among the top 10 things to do in San Diego — a free-entry beachfront destination anchoring Mission Beach for the 32 million visitors who come to the city each year. The Giant Dipper roller coaster, built for $50,000 in 1925, is a National Historic Landmark and one of the oldest operating wooden coasters in the United States.
With an estimated 2 million visitors annually, Belmont Park runs the operational complexity of a mid-size enterprise: staffing, guest traffic, retail, maintenance, and finance constantly influencing one another across five departments — each making daily decisions that are only as good as the data behind them.
As the centennial created renewed momentum and a major ride rehabilitation was underway, leadership recognized that the next phase of growth required operational clarity: not new attractions alone, but a full view of how the business actually performed.
The Challenge
Seven Systems. Seven Versions of the Truth
Belmont Park wasn’t lacking information. Valuable data was being generated every day across ticketing, finance, retail, HR, parking, guest analytics, and maintenance systems.
The problem was that each department viewed the business through its own lens. Finance had one set of reports. Operations relied on another. Retail teams tracked different metrics altogether. By the time information was consolidated and shared across departments, many decisions had already been made.
The organization wasn’t struggling to collect data. It was struggling to connect it.
7 Disconnected Sources
Ticketing System (API)
Point of Sale (Raw SQL)
HR / Payroll (CSV)
Finance (Legacy)
Parking & IoT
Guest Analytics
Maintenance Logs
The result: 68% of critical operational fields contained inconsistencies, missing values, or lacked cross-system mapping — leaving Finance, Operations, and Retail unable to correlate what each department was seeing.

Inside the Room
The Visible Problem Wasn’t the Real Problem
Everyone was looking at the same business. They simply weren’t looking at the same picture.
Each department had its own system, its own reports, and its own version of what was happening. Ticketing saw a record-breaking weekend. Operations was managing an overloaded team. Retail was running out of inventory. Finance was watching costs spike. All of it was happening simultaneously — and none of it was visible across departments in real time.
“The hardest part wasn’t connecting the systems. It was making data from seven different sources speak the same language.”
— HebronSoft Engineering Team
What We Built
A Unified Data Platform for Operational Intelligence
Belmont Park didn’t need another reporting tool. The challenge was to connect systems that had evolved independently over many years without disrupting day-to-day operations.
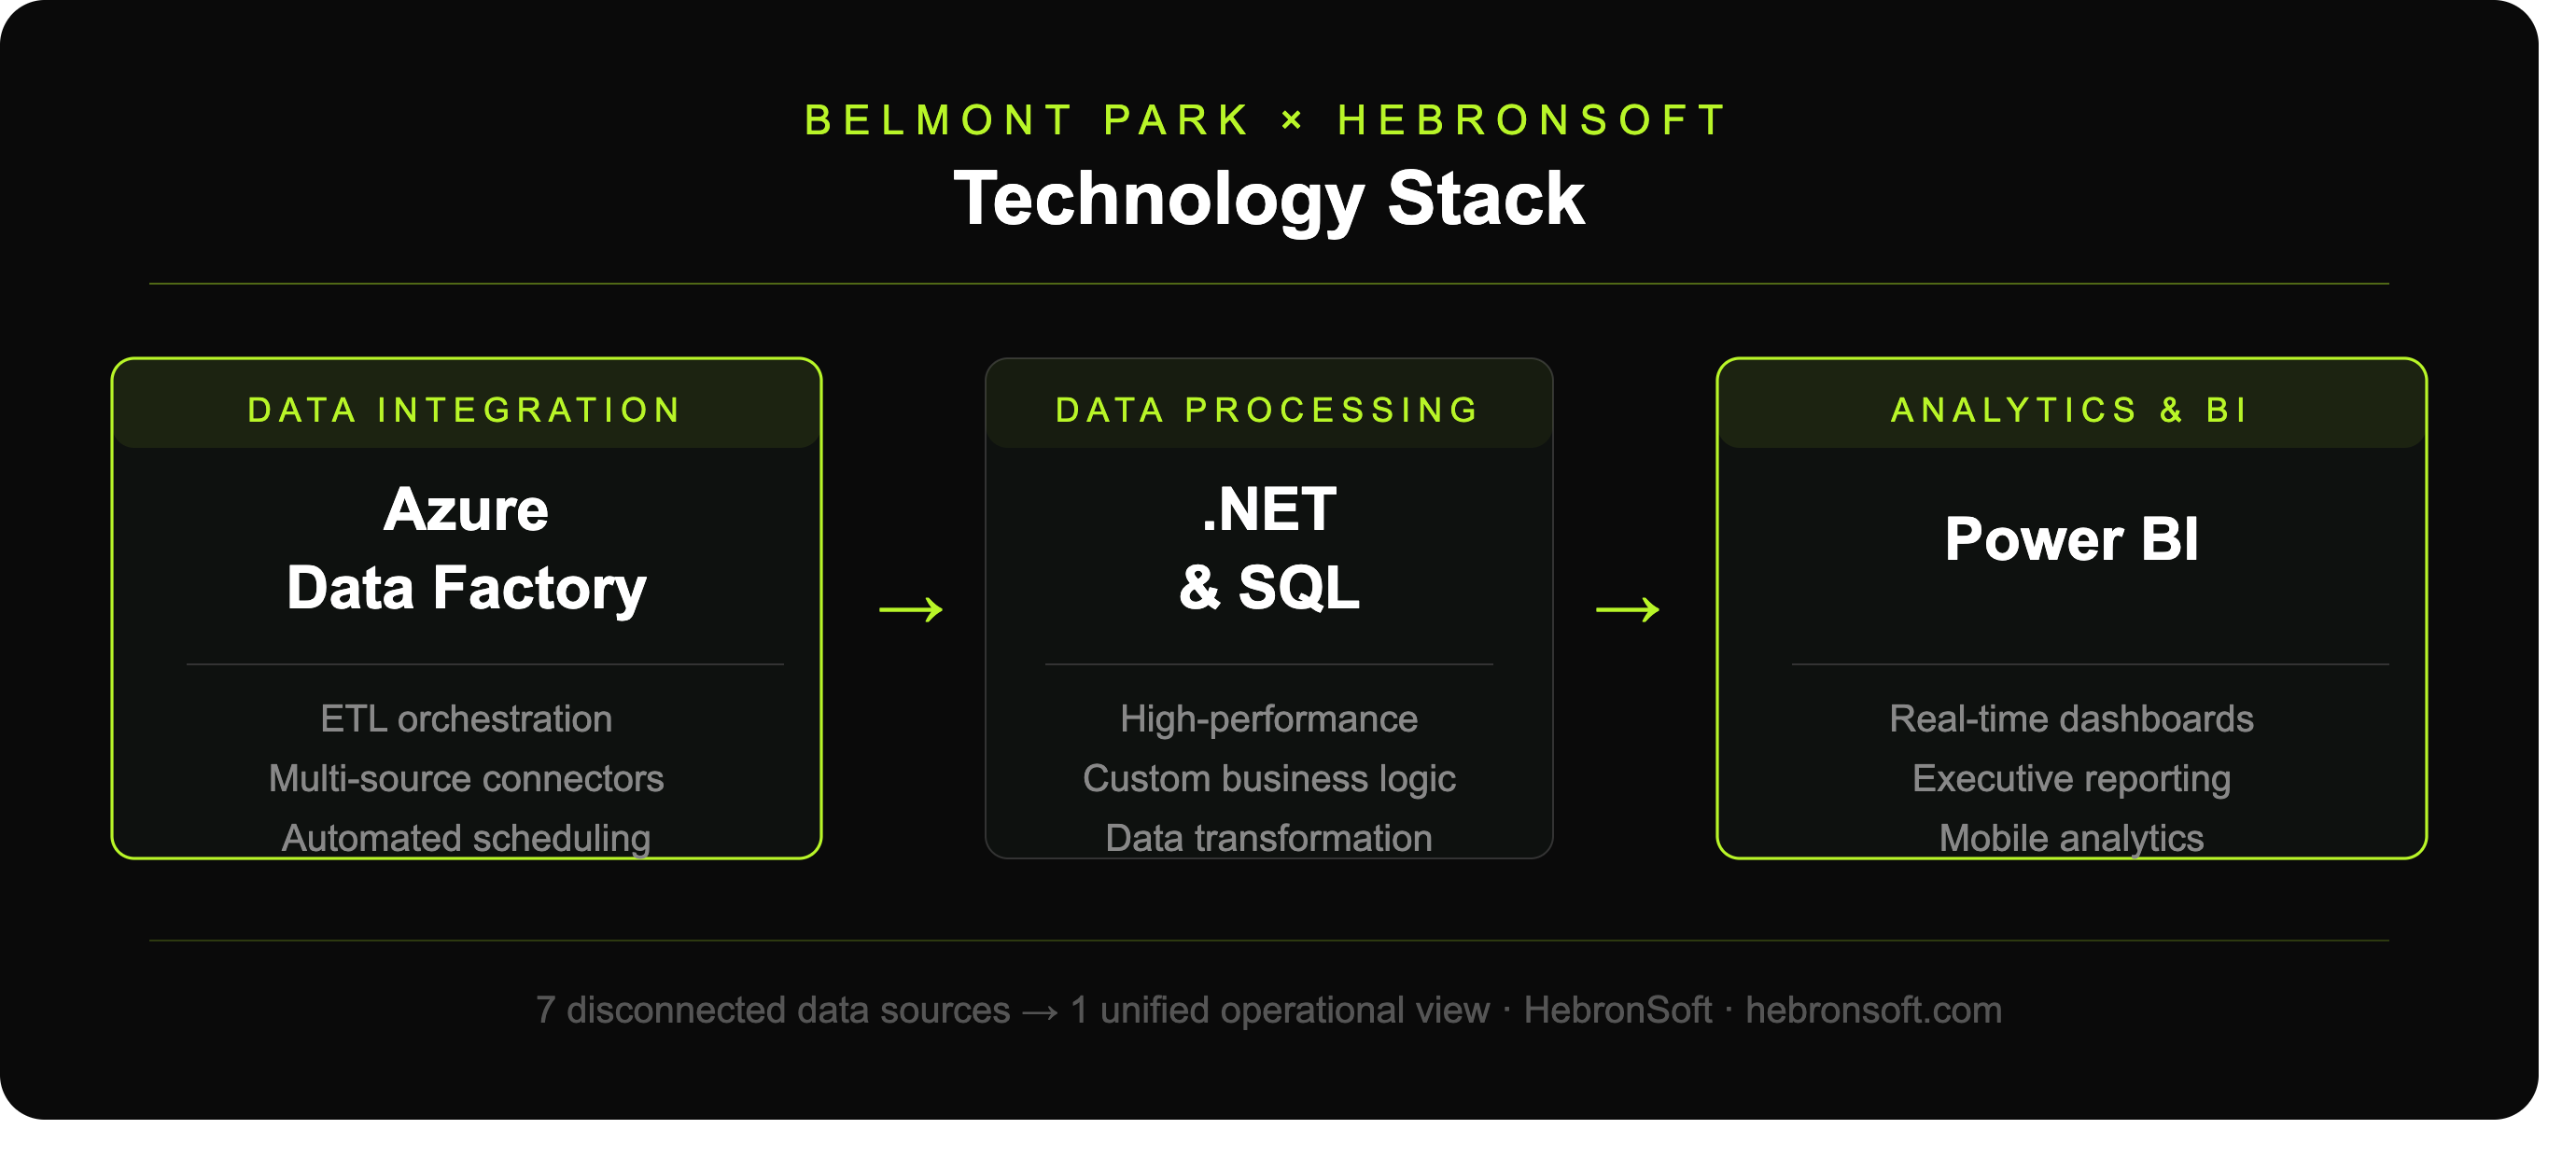
Azure Data Factory handled orchestration across seven source systems. .NET and SQL standardized and processed data across formats that had never been designed to talk to each other. Power BI gave every department access to the same operational picture — in real time, not at month end.
The result was a shared view of how the business actually operated — something no single department could produce on its own.
Security controls were built into the pipeline architecture, not added at handoff. HebronSoft operates under ISO/IEC 27001:2022 certification — covering client data handling, access controls, and infrastructure security across the full engagement.
Business Impact
One View Across the Business
For the first time, Finance, Operations, Retail, and HR were working from the same dataset — instead of reconciling competing reports before every decision.
Before / After
Before:
- No cross-system visibility
- Department-level reporting only
- Manual reconciliation across systems
- Monthly reporting cycles
After:
- Unified operational view across all departments
- Shared reporting environment for Finance, Operations, Retail, HR
- Cross-functional decisions without reconciling competing data
- Real-time dashboards replacing monthly report cycles
Hidden Correlations the Data Revealed
Finance → Operations: Q3 operational costs peaked 3 days before ticket sales surge. Staffing timing adjusted, identifying an estimated $847K annual cost reduction opportunity.
Operations → Retail: High-capacity days drive 3.5x retail conversion. Inventory repositioned in high-traffic zones, identifying an estimated $1.2M annual revenue opportunity.
Finance → Retail: Weather patterns correlate with $142 average guest spend variance. Dynamic pricing model deployed for weather-contingent days.
What We Learned
Validation Belongs at the Ingestion Layer
During testing, an incorrect value in a source spreadsheet propagated through several forecasting runs before it was caught. The pipeline logic behaved exactly as designed. The source data did not.
That’s a pattern that appears in most multi-source data projects. The forecasting layer gets the most attention. The ingestion layer gets the least. But that’s where errors enter — and where they need to be stopped.
Engineering insight: Since this project, validation rules, range checks, and anomaly detection are part of every ingestion workflow we build — scoped and tested the same way the rest of the pipeline is.

Helped us ideate, architect and design the whole data layer
Hebronsoft has proven to be an intelligent, professional and reliable tech advisor and software development partner. They have helped us not only to implement, but also to ideate, architect and design the whole data layer in connection with vital business acumen. I can't say enough good things, they are dedicated, responsible and technically innovative. Going extra mile to deliver the results.


You might be interested in
Inside Precision Opinion: Improving the Infrastructure Behind America’s Largest Surveys
HebronSoft helped stabilize and improve an undocumented AWS-based platform behind one of America’s largest survey research operations, restoring critical integrations and supporting active production workflows without disruption.

How DeveloperMedia Built a News Platform That Knows What Developers Actually Want to Read
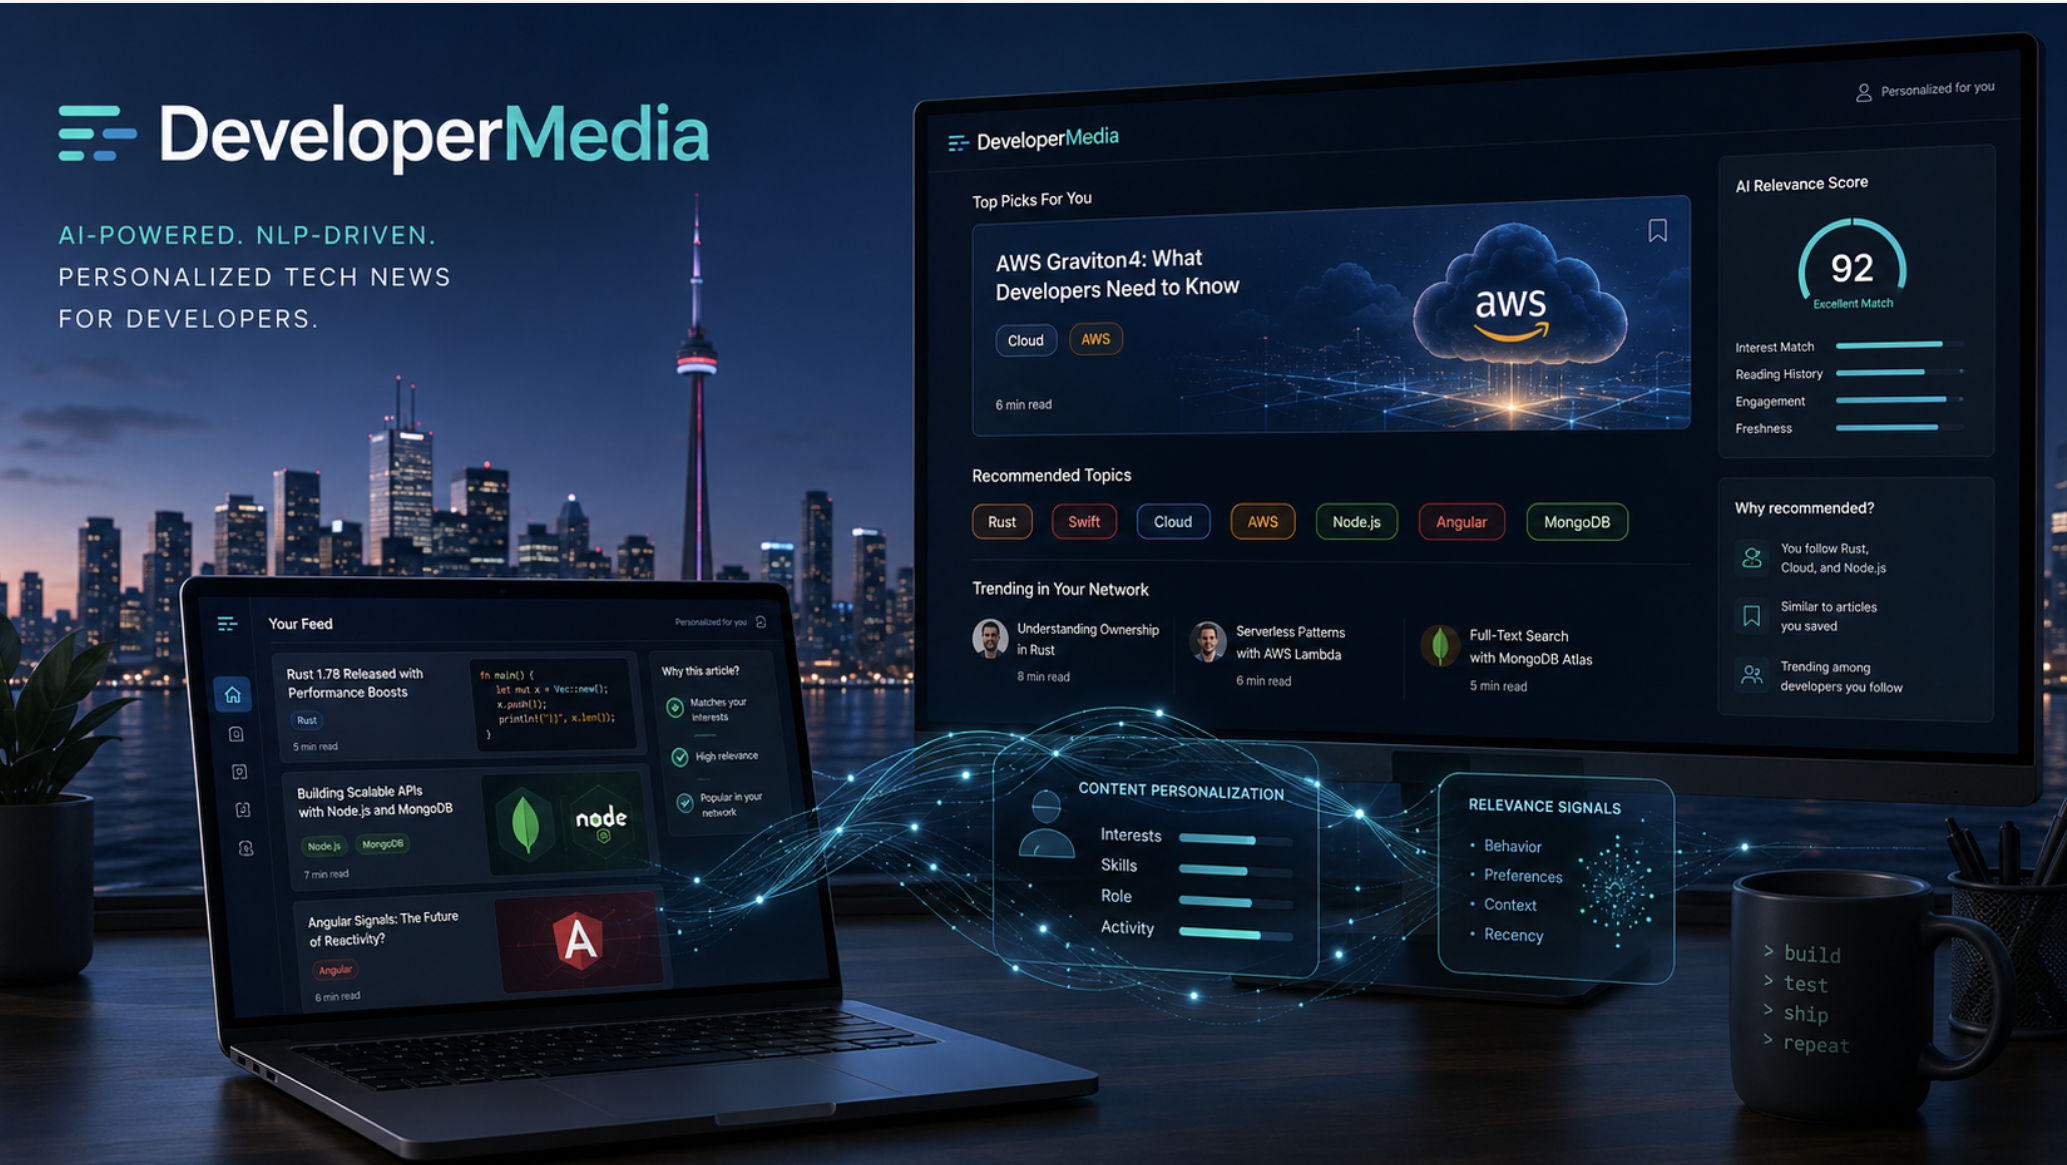
HebronSoft helped DeveloperMedia create a personalized content intelligence system that understands developer interests, reading behavior, technical context, and domain-specific signals across a fragmented media ecosystem.
How We Helped iPromote Bring Enterprise Advertising Capabilities to Small Businesses
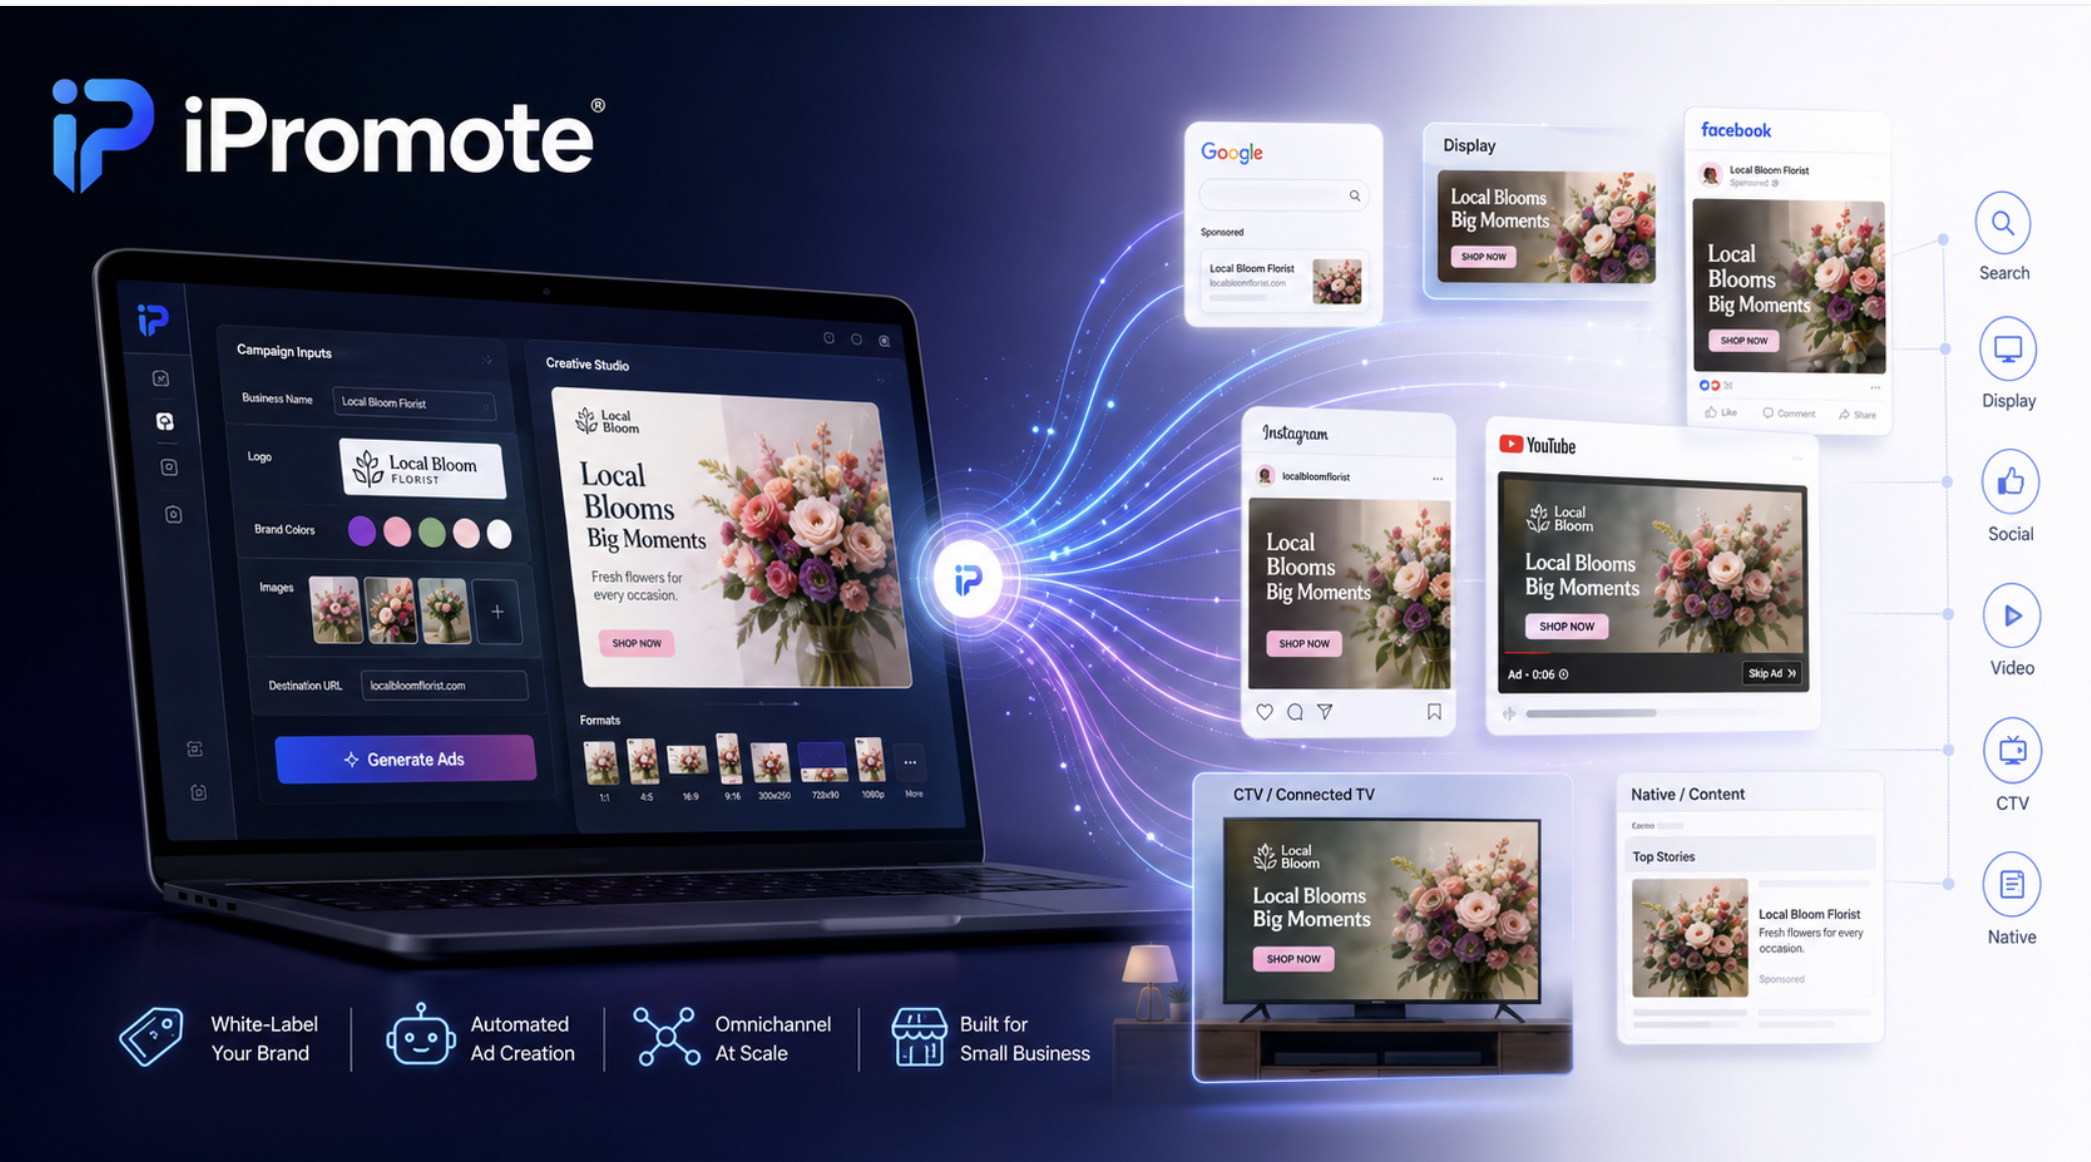
A multi-tenant white-label advertising system built around two core applications: Ad Template Designer and AdBuilder. Together, they transform one set of campaign inputs into correctly formatted creative across Google, Facebook, Instagram, YouTube, CTV, AppNexus/Xandr, Yelp, and Microsoft.
 AI Assistant